


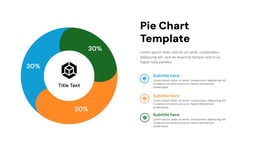
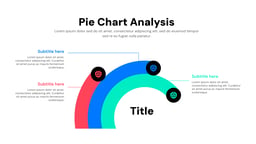
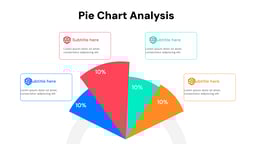
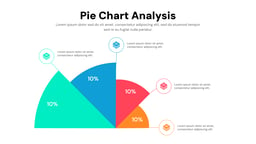
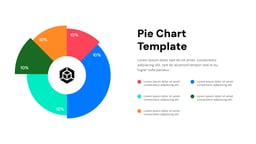
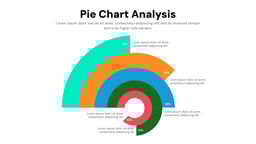
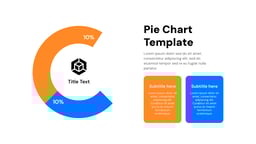
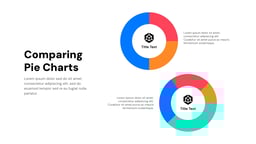
What Are Pie Chart Templates?
Pie Chart Templates are pre-designed presentation slides used to display data in a circular chart format. They help show percentages, proportions, and comparisons in a simple and visual way.
Create Presentations Easily in Google Slides and PowerPoint
14M+Installs
Application of Pie Chart Template
- Data Presentation: Used to present data in an easy-to-understand visual format.
- Business Reports: Helps show sales, revenue, and performance breakdowns.
- Marketing Analysis: Displays audience insights, campaign results, and market share.
- Educational Use: Used in schools and colleges to explain data and statistics.
- Financial Reports: Helps present budget distribution and expense breakdowns.
Why Choose Our Pie Chart Presentation Template?
- Clear Data Visualization – Makes complex data easy to understand.
- Professional Design – Clean and modern chart layouts.
- Easy to Customize – Quickly edit values, labels, and colors.
- Saves Time – Ready-made charts for quick use.
- Compatible with Popular Tools – Works with PowerPoint and Google Slides.
How to Use This Template?
- Microsoft Powerpoint: Click on Download > Click on “PowerPoint” > Click on the downloaded file to make a copy and start customising/editing the template
- Google Slides: Click on Download > Click on “Google Slides” > Click on “Use Template” to make a copy and start customising/editing the template
Build Stunning Slides in Seconds with AI
- No design skills required
- 3 presentations/month free
- Don't need to learn a new software
Frequently Asked Questions
How do I update the data in a pie chart template?
Most pie chart templates link to an Excel spreadsheet. Simply edit the data in the spreadsheet, and the pie chart in your presentation will automatically update.
Can I customize the look of the pie chart?
Yes! Most templates allow you to change the colors, fonts, and overall style to match your presentation theme.
How much data can I show in a pie chart?
Pie charts are best for showcasing a few categories, typically 4-6. Including too many data points can make it hard to read.
Are there other chart options besides pie charts?
Absolutely! Consider bar charts, column charts, or donut charts depending on your data and what you want to emphasize.
Does this template work in both Google Slides and PowerPoint?
Yes! The template is designed for use in either program. Just choose how you want to use it when downloading.
Can I customize the template to fit my brand?
Yes! You can customize colors, fonts, and graphics. You can even use presentation software’s AI tools to make quick text edits for further customization.
What format is the template in?
The template comes in .pptx format, which is compatible with PowerPoint and can be easily imported into Google Slides.
Do I need any special software to use the template?
You’ll need either Microsoft PowerPoint or Google Slides (a free online presentation tool).