Key Takeaways
- You can add your Excel dashboard to PowerPoint as an image, embedded object, or live link.
- Linked dashboards update automatically when Excel data changes.
- Embedded dashboards can be edited directly inside PowerPoint.
- Using Excel dashboards makes your presentations data-rich and engaging.
- Tools like SlidesAI help you design and present dashboards professionally in minutes.
If you are wondering how to add an Excel dashboard to PowerPoint, the good news is that it’s much easier than it looks. Whether you want a clean snapshot of your data or a fully interactive dashboard that updates in real time, PowerPoint gives you several ways to bring your Excel visuals into your slides.
This tutorial walks you through three simple methods, explains when to use each one, and helps you choose the best approach for your presentation. And if you want to take things further, tools like SlidesAI can transform your data-heavy slides into polished, professional designs in minutes. Now let’s get started.
How to Add an Excel Dashboard to PowerPoint in 3 Easy Ways
Creating a powerful presentation doesn’t always mean starting from scratch. If you already have an Excel dashboard, you can easily showcase that data in PowerPoint and make your slides more visual, interactive, and professional. Check out three easy methods to do it:
Method 1: Insert an Excel Dashboard as an Image in PowerPoint
The quickest way to add an Excel dashboard to PowerPoint is by inserting it as an image. This is perfect when you want a simple, static view of your data that doesn’t need live updates.
Here’s How to Do it:
1. Open your Excel file that has the dashboard you want to share.
- Make sure everything looks right. Adjust column widths and charts before copying.
2. Select your entire dashboard.
- You can do this by dragging your mouse over the range of cells or pressing Ctrl + A if it’s the only thing on the sheet.
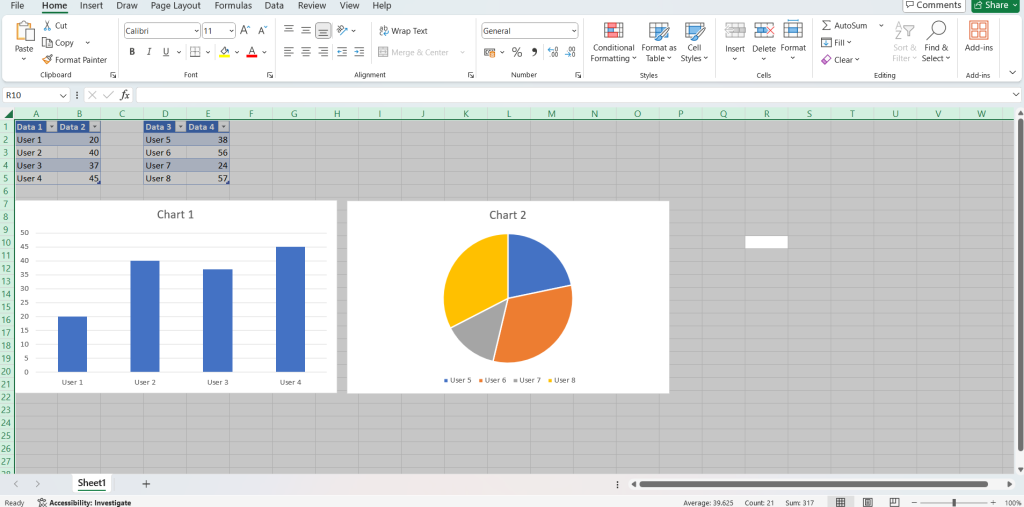
3. Copy the dashboard.
- Go to Home > Copy (or use Ctrl + C).
4. Open your PowerPoint presentation and pick the slide where you want the dashboard to appear.
5. Paste it in the selected slide.
- Go to Home > Paste (Ctrl + V).
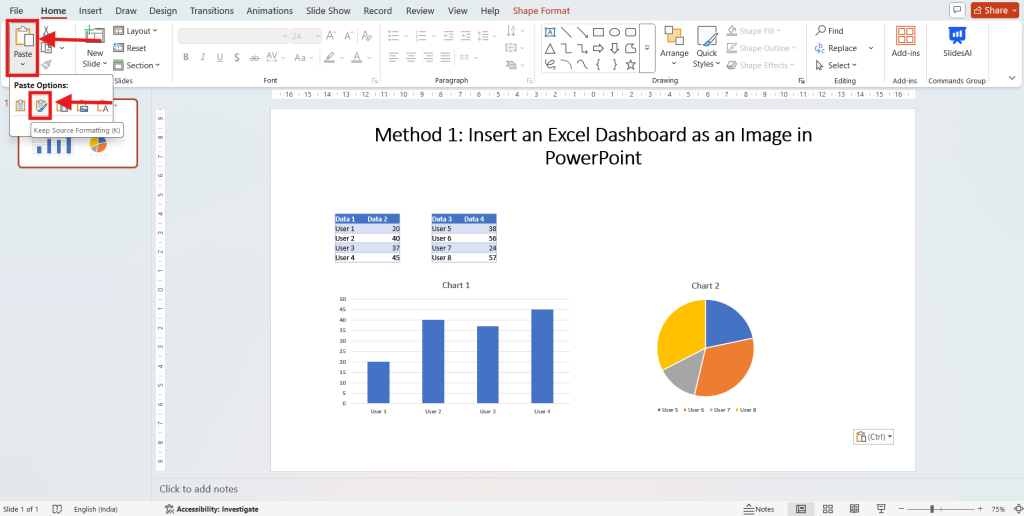
This way, your Excel dashboard appears on the slide as a static image. It won’t update if the Excel file changes. However, it’s ideal for presentations where the data doesn’t need real-time updates.
Method 2: Insert a Live Excel Dashboard in PowerPoint
Want to know how to use an Excel dashboard in PowerPoint that stays updated automatically? You can insert a live dashboard that reflects every change you make in Excel. No need to re-copy or re-paste!
Follow These Steps:
1. Open your Excel file that contains the dashboard.
2. Select your dashboard area so only the relevant data and visuals are copied.
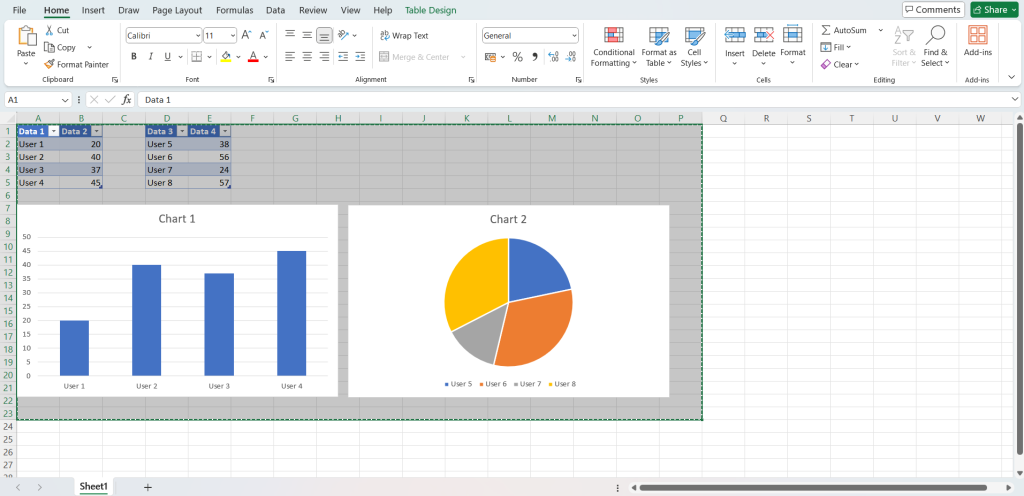
3. Copy the dashboard.
- Click Home > Copy or press Ctrl + C.
4. Open PowerPoint and go to the slide where you want to add your dashboard.
5. Click Home > Paste > Paste Special.
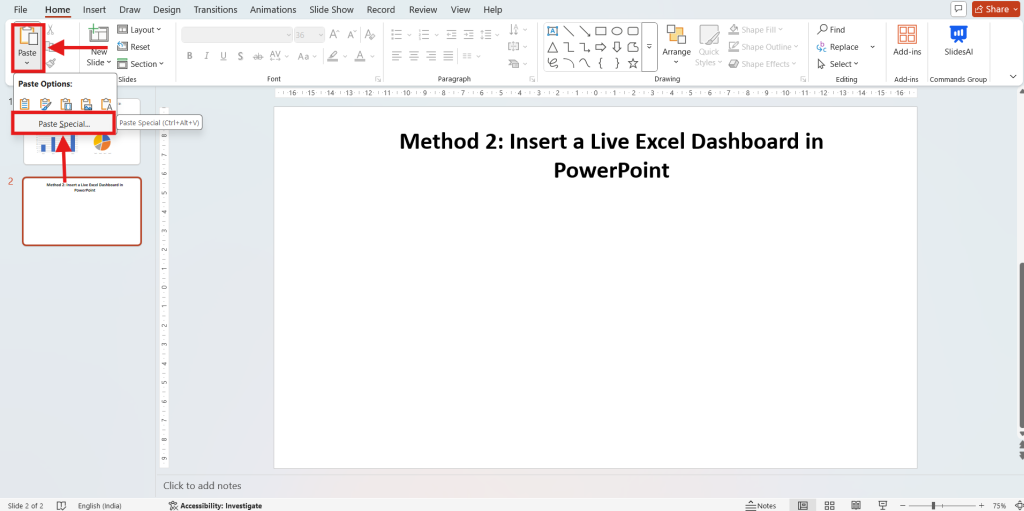
6. In the dialog box, select Paste Link > Microsoft Excel Worksheet Object, then click OK.
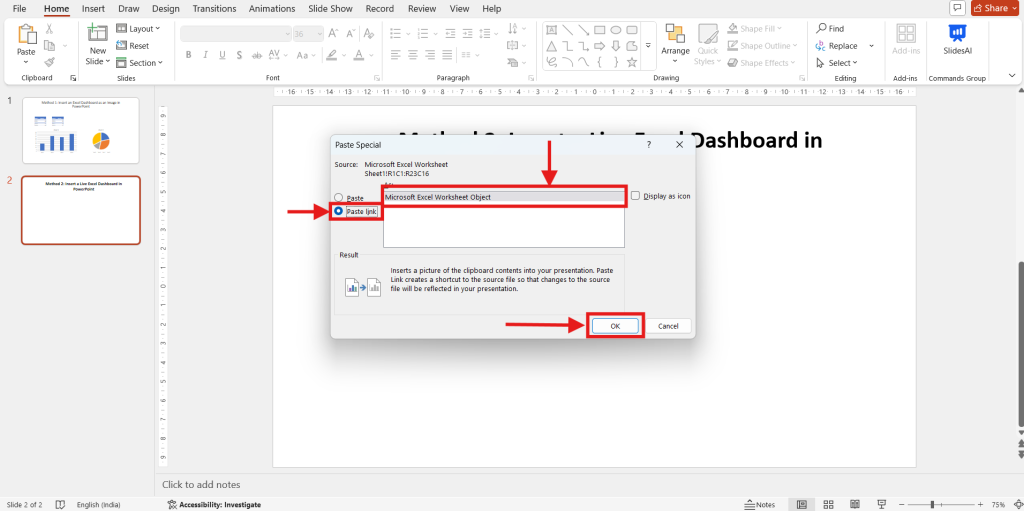
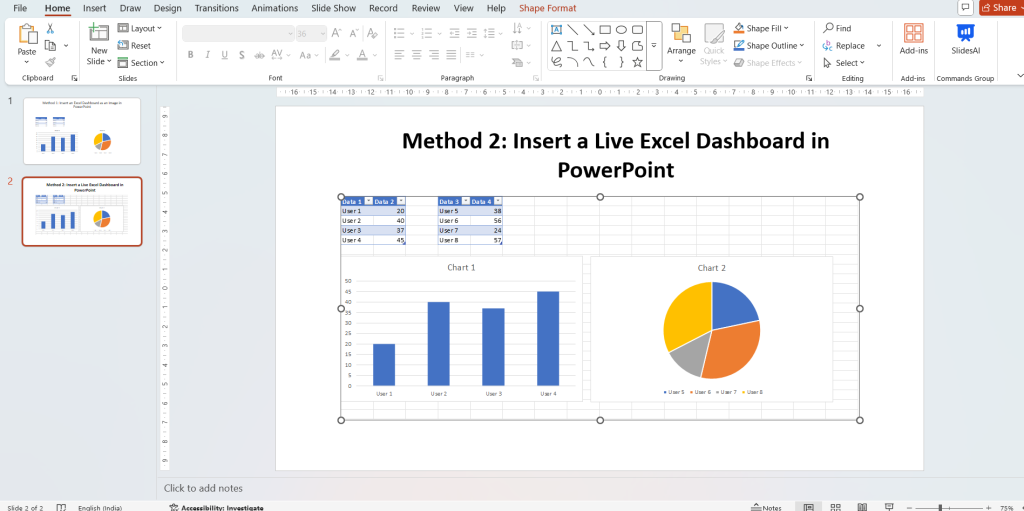
That’s it! Your dashboard is now live in PowerPoint. Any edits you make in Excel, like updating numbers or refreshing charts, instantly appear on your slide.
Tip: Keep your Excel and PowerPoint files in the same folder so the link doesn’t break when you move them.
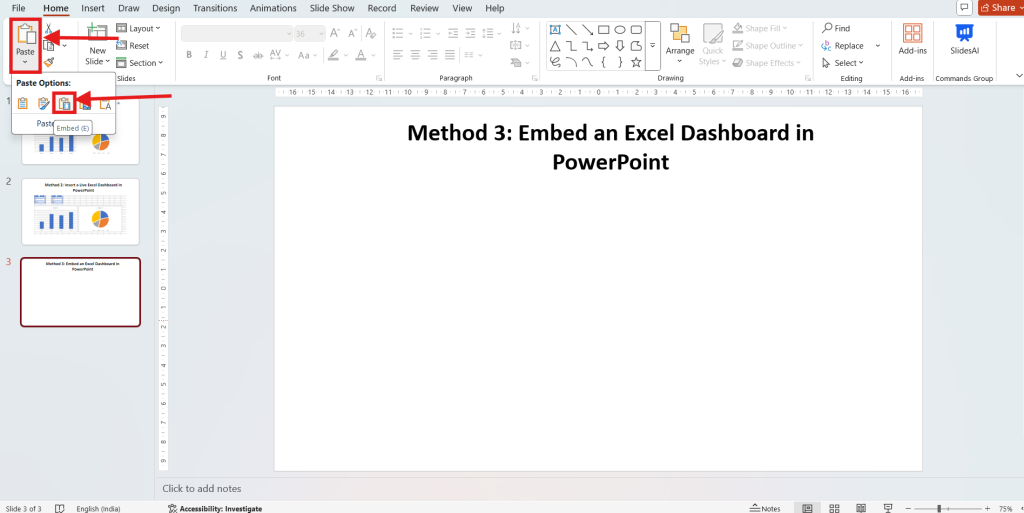
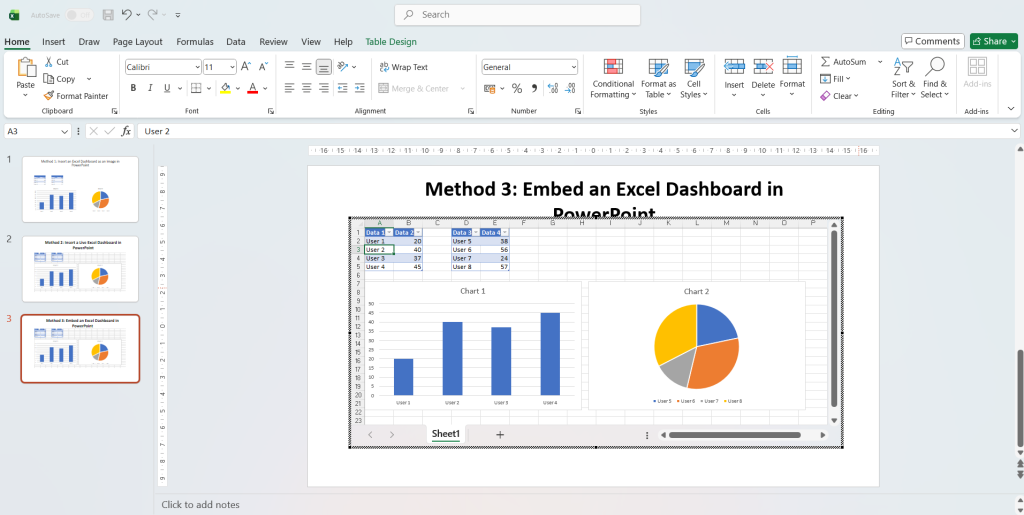
Method 3: Embed an Excel Dashboard in PowerPoint
Embedding works best when you want to edit your dashboard directly inside PowerPoint without switching back to Excel.
Here’s How:
1. Open your Excel file and highlight your dashboard.
2. Copy it using Home > Copy or Ctrl + C.
3. Go to PowerPoint and choose the slide you want to use.
4. Paste it as an embedded object.
- Click Home > Paste > Embed (E).
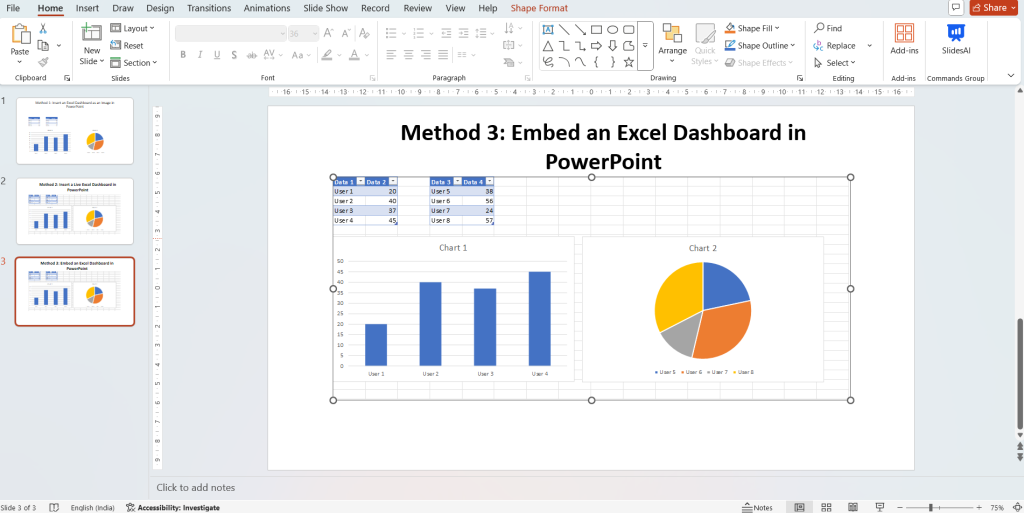
5. Double-click the embedded dashboard whenever you want to make edits.
You can tweak data, charts, or visuals directly in PowerPoint. However, remember, changes won’t sync back to Excel since this version is a standalone copy.
Tip: Before embedding, save both files to a single folder and name them clearly to avoid confusion.
The Main Advantages of Including Your Excel Dashboard in PowerPoint
Not only is embedding your dashboard convenient, but it also enables faster, more effective data communication. Here’s why:
1. Instantaneous Data Updates
When linked, Excel updates are automatically reflected in your PowerPoint, maintaining the accuracy and freshness of your presentation.
2. Simplified Workflow
Update once, and it synchronizes everywhere, eliminating the need to alternate between Excel and PowerPoint.
3. More Captivating Presentations
Interactive visuals and dashboards help your audience stay focused and quickly understand insights.
4. Professional Look and Feel
Your slides will appear crisp and contemporary because embedded dashboards preserve their Excel formatting.
5. Interactive Analysis
You can discuss data in real time while making fast changes or updates straight in PowerPoint.
6. Business Reporting Made Easy
Whether it’s for analytics reports, monthly updates, or executive summaries, embedding makes it quick and easy. To conclude, your PowerPoint presentations become more intelligent, quicker, and interactive when an Excel dashboard is added to PowerPoint. You always have the freedom to confidently and clearly display your data, whether you decide to embed it, link it live, or insert it as an image.
Do you want to improve the appearance of your dashboards without requiring any design knowledge?
Try SlidesAI to quickly turn your data-heavy slides into polished, business-like presentations!
Create Presentations Easily in Google Slides and PowerPoint
- No design skills required
- 3 presentations/month free
- Don't need to learn a new software

Frequently Asked Questions Around Adding Excel Dashboard in PowerPoint
1. What distinguishes linking an Excel dashboard in PowerPoint from embedding it?
A copy that can be edited within PowerPoint is produced by embedding. By keeping the dashboard linked to Excel, updates made in Excel are automatically reflected in PowerPoint.
Is it possible to edit an embedded dashboard in PowerPoint directly?
Indeed! Without exiting PowerPoint, you can alter the text, tables, or charts. You simply need to double-click it to begin editing.
If I make changes to the Excel data, will my embedded dashboard update automatically?
No, only dashboards that are linked can do that. Embedded copies are independent.
Does my Excel dashboard’s formatting change when I embed it?
Not at all! The original Excel layout, colors, and fonts are retained in PowerPoint.