
An organizational chart is a visual representation of a company’s internal structure. It shows how roles, responsibilities, and relationships are distributed across teams. It outlines the hierarchy clearly, making it easier to understand who reports to whom and how departments are connected. Whether you’re onboarding new employees, presenting to stakeholders, or streamlining internal communication, an org chart helps simplify complex reporting lines and boosts overall transparency. In this blog, we will guide you through how to create an organizational chart in PowerPoint. Let’s first understand why we need it.
6 Methods to Create an Org Chart in PowerPoint?
Learning how to create an organizational chart in PowerPoint helps you clearly present team structures and reporting lines. Whether you’re building from scratch or using built-in tools, PowerPoint offers several easy methods to get started.
Method 1: Using SlidesAI Org Chart Template
Step 1. Go to SlidesAI
Visit the SlidesAI website and open the platform in your browser. This is where you’ll access ready-made presentation templates.

Step 2. Open template library
From the main menu, click on Free Templates, then select More Templates to browse the full template library.

Step 3: Search for Org Chart Presentation Template
Use the search bar to find an org chart presentation template. These templates are designed to display organizational structures and hierarchies clearly.

Step 4: Download the template for PowerPoint
Select the org chart template you like and open or download it. You can use it directly in Google Slides or edit it in PowerPoint for flexibility.

Step 5: Make Necessary Edits
Customize the template by updating names, roles, images, colors, and text. Adjust the layout to match your organization’s structure and branding needs.
Create Presentations Easily in Google Slides and PowerPoint
14M+Installs

Method 2: Using a PowerPoint Built-In Template
PowerPoint offers pre-designed org chart templates that make building your company structure fast and simple. Here’s how to get started:
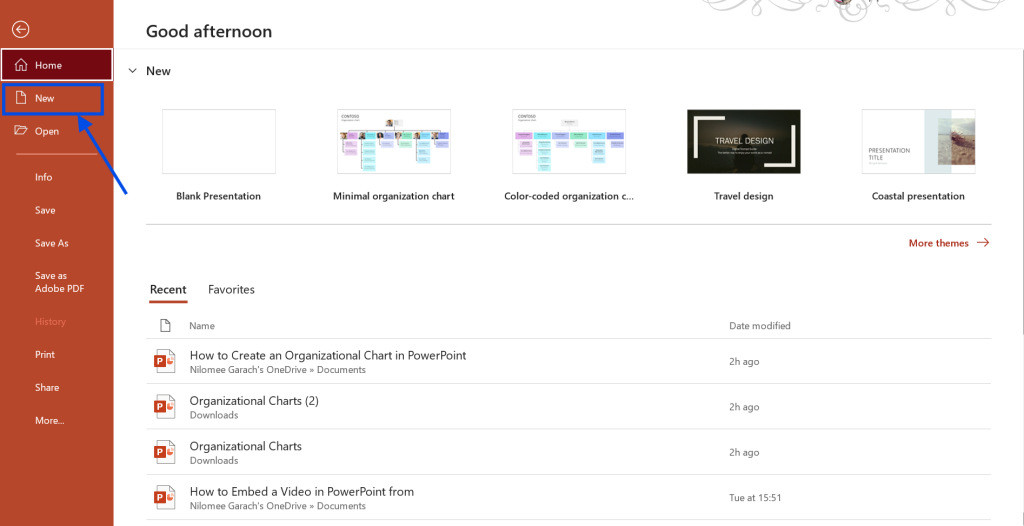
Step 1: Open PowerPoint and Go to File > New
Launch PowerPoint and click on the File tab in the top-left corner. From the dropdown, select New to create a new presentation.
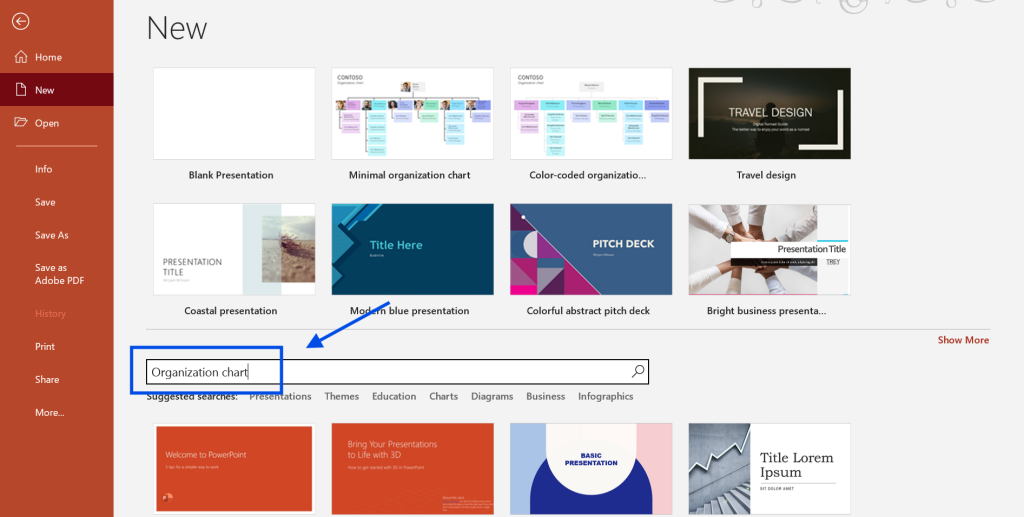
Step 2: Search for an Org Chart Template
In the search bar that says “Search for online templates and themes,” type “org chart” and hit Enter or click the magnifying glass icon.
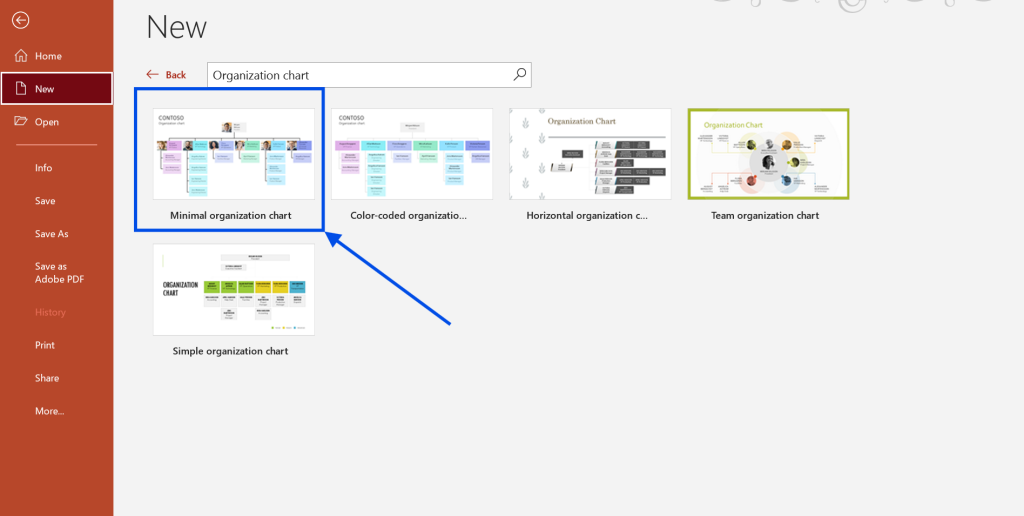
Step 3: Choose a Template
Browse through the available organizational chart templates. Select the one that fits your needs and click Create to open it in a new presentation.
Step 4: Customize the Template
Replace the placeholder text with your team’s names, job titles, and departments. You can easily adjust the layout, add or remove roles, change colors, and insert images to reflect your branding.
Method 3: Create an Organizational Chart in PowerPoint with SmartArt
If you prefer to build your organizational chart from scratch, SmartArt in PowerPoint makes the process intuitive and flexible. Here’s how to do it step by step:
Step 1. Open PowerPoint and Choose a Slide Layout
Start with a new or existing presentation. Select a blank or title-and-content layout for a clean workspace.

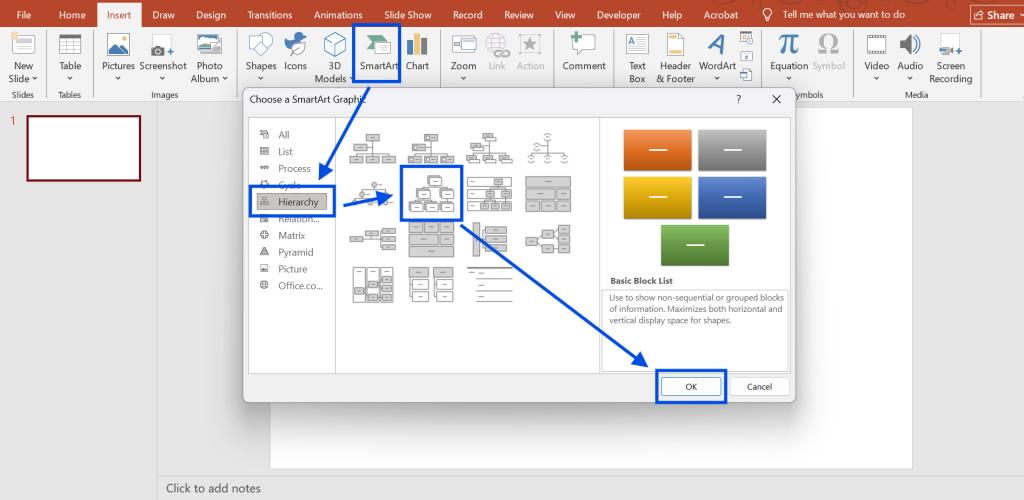
Step 2. Insert SmartArt Graphics
Go to the Insert tab in the ribbon and click on SmartArt. In the pop-up window, select Hierarchy from the left sidebar, then choose an org chart style like “Organization Chart” and click OK.
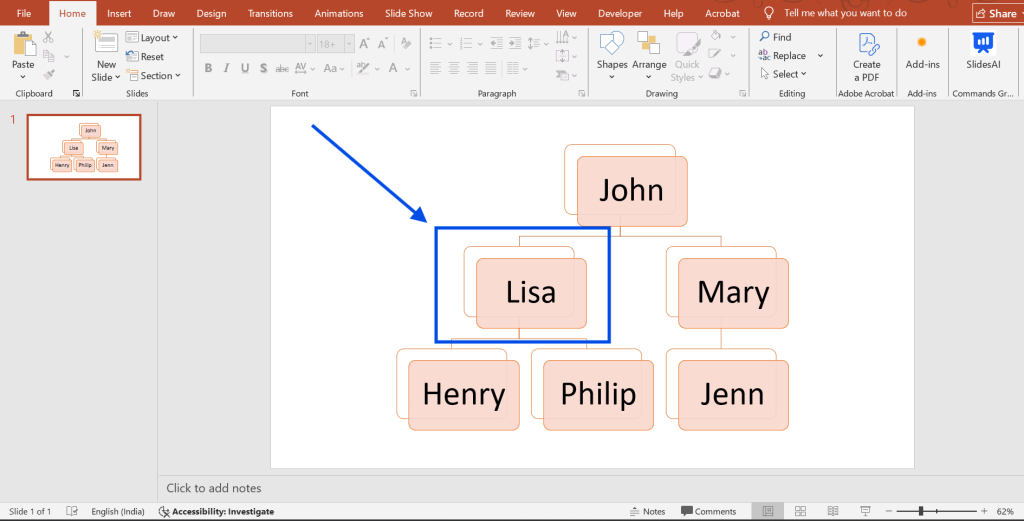
Step 3: Add Text and Edit the Hierarchy
Click inside the shapes to enter names, titles, or departments. Use the text pane or click directly in the shapes to edit your org structure.
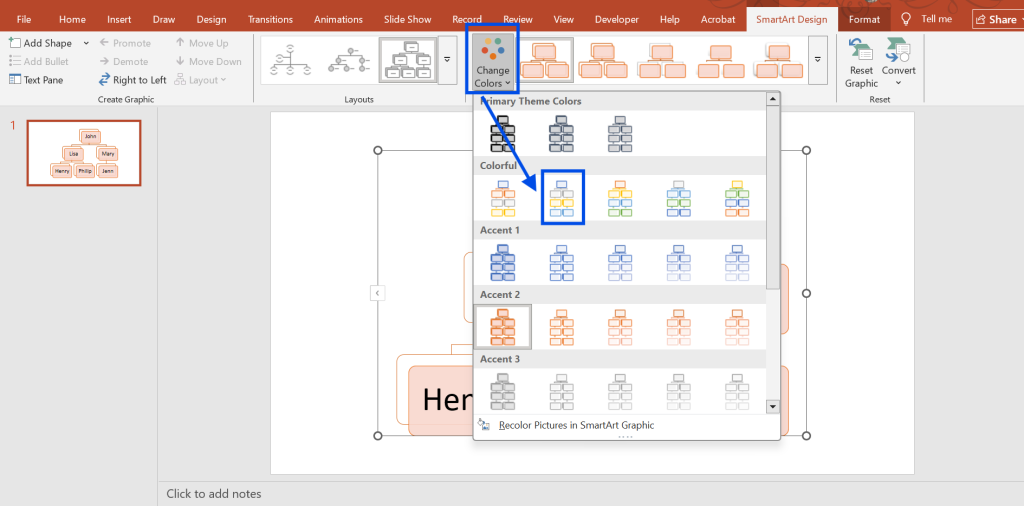
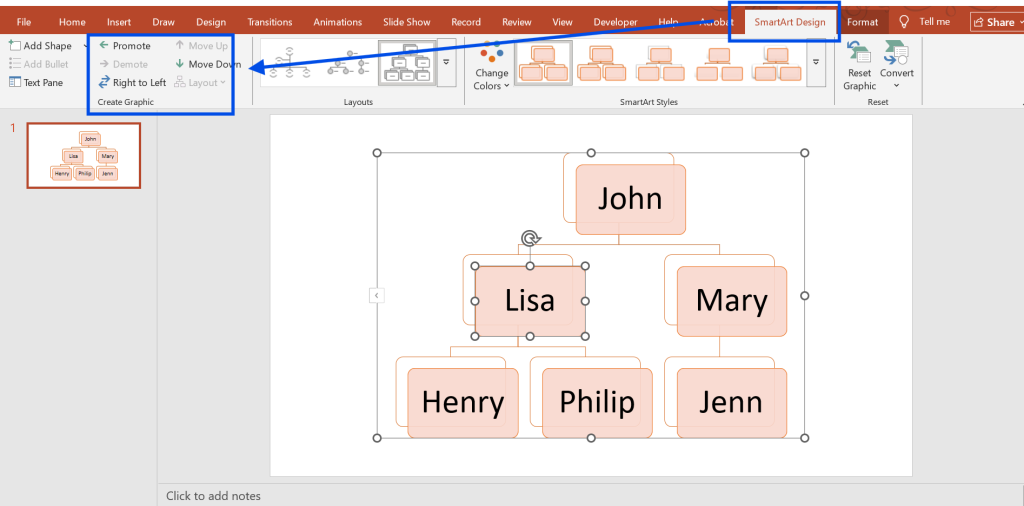
Step 4: Customize Design and Colors
Use the SmartArt Design tab to change colors, styles, and layouts. You can match your brand colors or adjust the style to make it clearer and visually appealing.
Step 5: Rearrange and Expand the Chart
Easily restructure the chart using Promote, Demote, Move Up, or Move Down options in the SmartArt Design tab. Add more boxes using Add Shape to include new roles or departments.
Step 6: Save and Export the Slide
Once done, you can save the presentation or export the org chart as a PDF, image, or embed it in other Microsoft Office documents.
Build Stunning Slides in Seconds with AI
- No design skills required
- 3 presentations/month free
- Don't need to learn a new software

Method 4: Create an Organizational Chart in PowerPoint with Shapes
For those who want complete control over their org chart’s structure and design, using basic shapes in PowerPoint offers unmatched flexibility. This method lets you build the chart element by element, ideal for custom or non-traditional hierarchies.
Step 1: Open PowerPoint and Choose a Slide Layout
Start with a new slide and select a blank layout for a clutter-free canvas. This gives you full space to design your hierarchy from scratch.
Step 2: Pick a Shape to Represent the Hierarchy
Go to the Insert tab and choose Shapes. Use rectangles for roles or positions, or explore other shapes like ovals or rounded rectangles, depending on your visual preference.
Step 3: Create a Hierarchy
Manually place shapes to represent the different levels in your organization. Begin with top-level roles and add shapes below for subordinates or departments.
Step 4: Use Connectors to Connect the Hierarchy
Head back to the Insert > Shapes menu and select a Line or Elbow Connector. Connect shapes by dragging from one to another. Make sure to use consistent connector styles to keep the structure clean.
Step 5: Highlight Different Positions in the Organization
Use different colors, outlines, or shape styles to visually differentiate roles, like team leads, managers, or executives. This helps make the chart more understandable at a glance.
Step 6: Format Org Chart in PowerPoint
Select individual shapes or connectors to adjust fill colors, borders, font sizes, or alignments. Use the Align and Distribute tools under the Shape Format tab to keep your layout neat and balanced.
Method 5: Create an Organizational Chart in PowerPoint With Text Box
If you want an easy way to show your company’s structure, using text boxes and bullet points works well. This method is great for basic org charts where you don’t need a lot of design.
Step 1: Open PowerPoint and Choose a Slide Layout
Start with a new presentation and choose a title and content or blank slide layout, depending on your preferred visual structure.
Step 2: Insert a Text Box
Go to the Insert tab and click on the text box. Click anywhere on the slide to create the text box, then start typing your organizational structure.
Step 3: Select Bullet Points and Add the Main Head
Activate bullet points from the home tab. Type the name or title of the top-level position, e.g., CEO or founder, as the first bullet point.
Step 4: Add Subordinates with Indented Bullets
Press enter to create a new bullet for the next role. To nest it under the main role (as a subordinate, press the tab key; this will indent the bullet and visually show the hierarchy. Continue this pattern for all team levels.
Step 5: Save and Export the Slide
Once done, save your presentation and export it as a PDF or image if needed. This format works well for printing or quick sharing.
Create Presentations Easily in Google Slides and PowerPoint
- No design skills required
- 3 presentations/month free
- Don't need to learn a new software
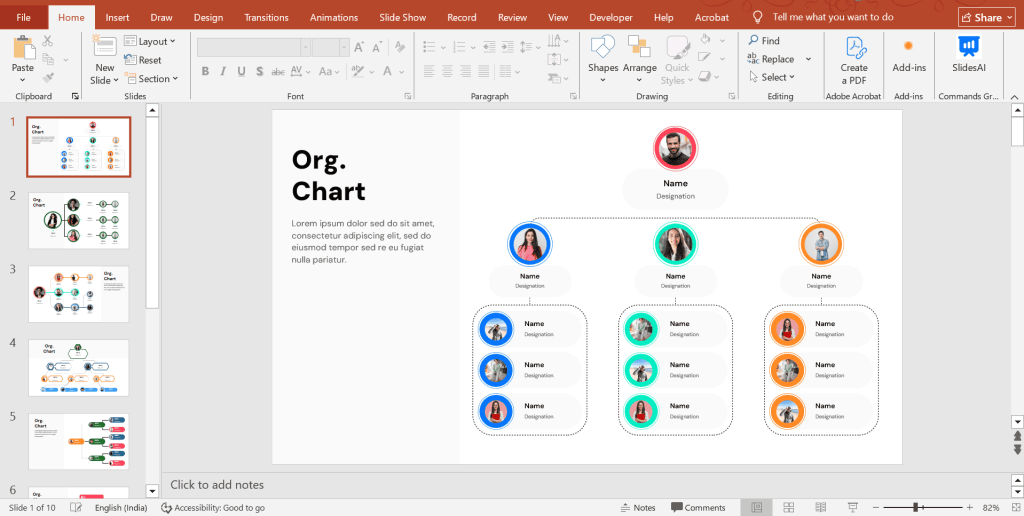
Method 6: Create an Organizational Chart in PowerPoint with Profile Photos
Want to make your org chart more engaging? Adding profile photos is a great way to personalise your team structure. Here’s how to do it in PowerPoint:
Step 1: Open PowerPoint and Choose a Slide Layout
Start a new slide with a clean layout like “Blank” or “Title and Content” for better space management.
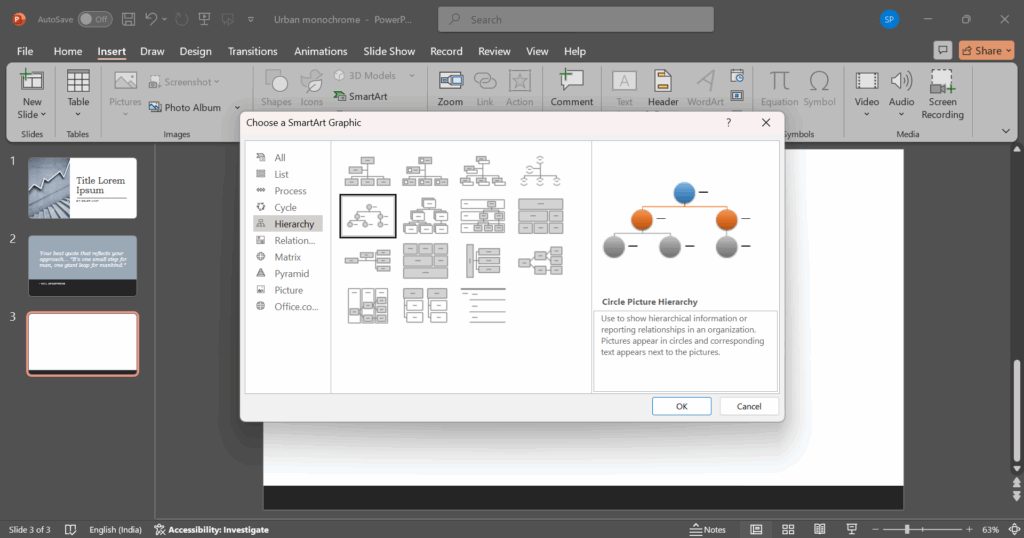
Step 2: Insert SmartArt Graphics
Go to the top menu, click on Insert > SmartArt, and open the SmartArt Graphic gallery.
Step 3: Select Circle Picture Hierarchy
In the Hierarchy section, choose Circle Picture Hierarchy. This layout is designed to include both names and profile photos.
Step 4: Insert Your Photos
Click the photo icon in each circle to upload images from your computer. These could be headshots or any professional team photos.
Step 5: Style Your Photos
Once added, you can crop, resize, or apply picture styles (like soft edges or shadows) from the Picture Format tab to match your brand’s look.
Step 6: Align and Position Photos
Drag and drop elements to adjust spacing, or use the Align tools in the Format menu to tidy everything up for a clean, polished org chart.
Already have your team photos ready? SlidesAI’s AI PowerPoint maker can help you wrap them into a full stakeholder or onboarding presentation with minimal effort.
Why Use PowerPoint for Organizational Charts?
PowerPoint isn’t just for slide shows; it’s a versatile design tool that makes creating and presenting organizational charts simple and efficient. Here’s why it’s a go-to choice:
1. Built-in Tools and SmartArt Options
PowerPoint includes SmartArt graphics specifically designed for hierarchy structures. With just a few clicks, you can select a built-in org chart template, add names and positions, and the chart automatically adjusts its layout. It removes the need to draw boxes manually or format each element from scratch.
2. Easy Customization and Presentation-Ready
Once your chart is in place, PowerPoint lets you easily personalize the design. You can change colors, fonts, and shapes to match your brand or presentation theme. Want to add headshots, department names, or extra notes? You can do it all without affecting the overall layout. Plus, the chart looks polished and is instantly ready to present or share.
3. Integration with Microsoft Office Suite
Since PowerPoint is part of the Microsoft Office ecosystem, you can seamlessly import data from Excel or Word to build your chart faster. Need to collaborate with others? Edits made in a linked Excel file can update your chart, making teamwork and version control smoother across departments.
If you are wondering how to create an organizational chart in PowerPoint, it is easier than ever, whether you’re using built-in templates, SmartArt, shapes, or text boxes. With PowerPoint’s flexibility and user-friendly tools, you can quickly design a clear and professional chart that represents your team structure effectively. For added visual impact, try using profile photos to humanize your hierarchy and make your presentation more engaging.
Whether you’re presenting to stakeholders, onboarding new hires, or simply organizing internal teams, a well-made org chart helps everyone understand how your organization works at a glance.
Create Presentations Easily in Google Slides and PowerPoint
14M+Installs
Frequently Asked Questions
1. Can I build an org chart in PowerPoint without SmartArt?
Absolutely. You can manually create one by using shapes, text boxes, and connectors. While this method gives you full control over the design, it may take more time compared to using SmartArt.
2. Does PowerPoint have built-in org chart templates?
Yes, PowerPoint offers a variety of ready-made templates for organizational charts. You can find them by searching “org chart” when creating a new presentation.
3. Can I use Excel data to make an org chart in PowerPoint?
Not directly. PowerPoint doesn’t allow automatic org chart generation from Excel data, but you can manually use the information from your Excel sheet to build the chart using SmartArt or other methods.
4. Is it possible to animate an org chart in PowerPoint?
Yes. You can add animations like fade-ins or fly-ins to individual elements or entire sections of your org chart using the Animations tab.
5. What’s the ideal org chart style for a small team?
For smaller teams, a basic top-down (hierarchical) or horizontal layout is usually the most effective. These formats keep the structure clear and easy to follow.